


This Jmol Exploration was created using the Jmol Exploration Webpage Creator from the MSOE Center for BioMolecular Modeling.
This tutorial focuses on protein structure and the intramolecular forces that are involved in protein folding and stability. This section is an introduction to a variety of ways of depicting proteins, as well as some common color schemes used in depicting proteins. All the proteins used in this tutorial have had their structures determined using X-ray crystallography or NMR. These structures are deposited in the Protein Data Bank (PDB) for use by researchers, educators and students. The PDB accession numbers are provided for each protein in this tutorial, in case you want to explore the proteins further.
Throughout the tutorial, clicking on the buttons will launch a Jmol image of the protein on the screen at the right.
Once a protein appears in the Jmol window, wait until the image stops moving before pushing a button to execute another script. You may spin the protein (left mouse button click and drag), or, if you wish, you may use Jmol commands to explore the protein further. A Jmol Quick Reference Sheet and Jmol Training Guide are available if you want to play with the images. (WARNING: This can be a lot of fun!)
If you hover over an atom in Jmol, a popup window will identify the atom in the format:
[ASN]108:B CA #1888
where:
[ASN] is the 3 letter amino acid abbreviation (or 1 letter nucleotide, if it is a nucleic acid)
108: is the residue number
B identifies the chain name in the pdb file
CA identifies the atom type. (CA is the code for the alpha carbon)
#1888 identifies the atom number in the pdb file.
As you work through the tutorial, the question mark icon will signal that you need to answer a question. With some exceptions, these answers can be inserted directly into the Jmol Exploration, then emailed to your instructor by clicking the button at the end of the exploration. Alternately, you may download a copy of the worksheet.
There are three common formats for displaying proteins; each is used to show different features of the protein. Shown here is insulin (2HIU.pdb), a hormone that regulates blood sugar levels.
Spacefill depicts all atoms at their relative diameter.
Spacefill PDB ID: 2hiuThe backbone display only shows the central carbon atom (the alpha carbon) of each amino acid, with a solid line connected adjacent amino acids. It is sometimes called the alpha carbon backbone.
Backbone PDB ID: 2hiuA ball and stick display shows each of the atoms as balls, with sticks to indicate the bonding between atoms.
Ball and Stick PDB ID:2hiuEach representation has advantages and disadvantages. In many cases, researchers will display different aspects of a structure in different ways to convey important information. This next button reviews the three displays in succession.
Combination of Displays PDB ID: 2hiuRecord an advantage and a disadvantage of each type of display.
Color can be used effectively to communicate information about protein structure. Some proteins, such as insulin (2HIU.pdb), consist of more than one peptide chain. Here the chains are colored differently to visualize how they interact.
Color Chains PDB ID: 2hiuYou can also display the secondary structure of a protein. This view displays the secondary structure of a zinc finger protein (1ZAA.pdb). Zinc finger motifs are often found in proteins that bind to DNA (shown here in light blue). Here alpha helices are colored orange and beta pleated sheets are colored goldenrod. The gray regions of the backbone are loops and turns.
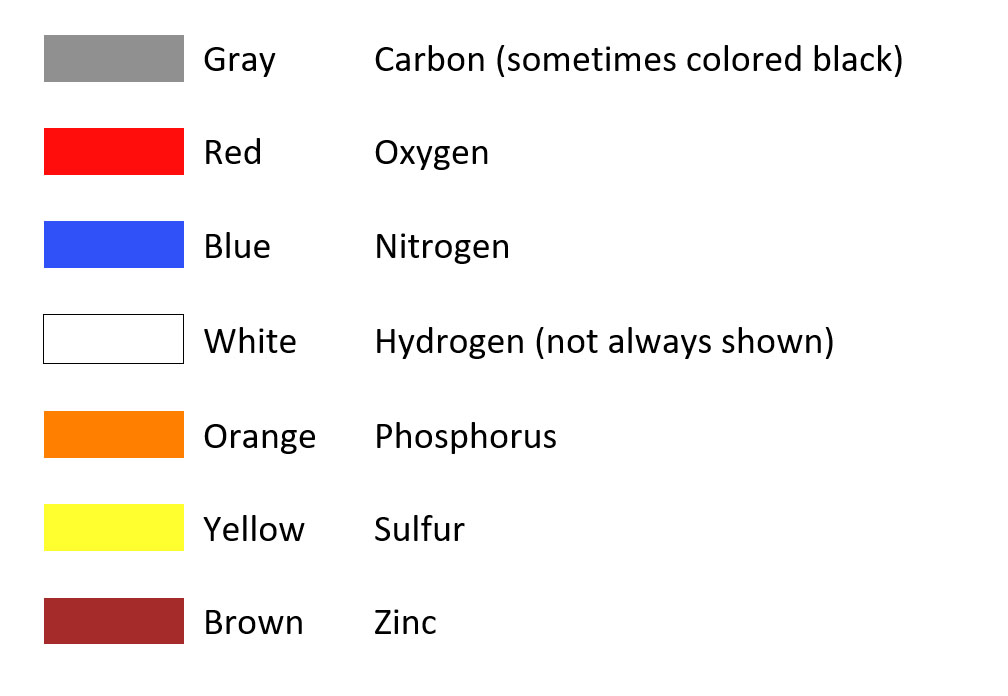
Color Structure PDB ID: 1zaaScientists use a standardized coloring scheme for identifying ATOMS in a structure. This standardized coloring scheme uses a specific color for each type of atom. The color scheme was developed by Robert Corey, Linus Pauling and Walter Koltun, and is called CPK coloring after the initials of their last names. Although it is not necessary to memorize these colors, you will see the most common colors frequently and will begin to recognize them as you look at molecular structures. Remember that these are standard colors to depict ATOMS – and colors can also be used to depict other features of a structure. In the CPK color scheme:
In addition to standard color schemes for various features, scientists will often use their own color scheme. In this case it is valuable to read the figure legend to determine what the colors signify.
This is an image of GATA-1 and FOG-1, proteins important in regulating which genes are turned on in development. This model was designed by the 2011 Mount Mary CREST Team. They colored the two protein backbones differently, then added important sidechains in CPK coloring. You'll learn more about these proteins later in the tutorial.
User Defined Color Scheme PDB ID: 1y0jHere are some other examples of user defined color schemes, using the same proteins, GATA-1 and FOG-1. See if you can figure out what the different colors represent, such as backbone regions or atoms. The possibilities are endless!
Blue Color Scheme PDB ID: 1y0jYou now know enough about how proteins are depicted to explore the four levels of protein structure. Enjoy the journey into the world of molecular visualization!
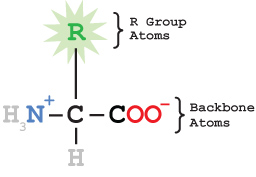
Proteins are built from twenty different amino acids, arranged in a specific order, like beads on a string. The order of the amino acids in the protein is called the primary structure of the protein. Each amino acid shares a common set of atoms that make up the amino acid backbone. Attached to the central carbon atom (the alpha carbon) is an atom or group of atoms that varies among the amino acids, making them all different. This group is sometimes called the R group or amino acid sidechain.
The chemical structure of a single amino acid is shown below, using CPK coloring scheme (except for the R group, which is in green).
Click the buttons below to see the same amino acid structure in Jmol in various formats.
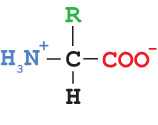
Wireframe Amino Acid StructureEach amino acid contains an amino group, a carboxylic acid group, an R group and a hydrogen atom attached to the central alpha carbon.
Click on each of the buttons below to see the labeled portion of the molecule colored orange.
Alpha CarbonThe twenty amino acids found in proteins only vary in their R groups, or sidechains. These functional groups provide unique properties important both in the way proteins fold and in the way proteins function. Amino acids are typically grouped into four classes. Below are examples of each class of amino acid, displayed using CPK coloring.
Hydrophobic R Group: LeucineWhat color and types of atoms make up each of the four R groups that you just looked at?
Amino acids are joined via a condensation reaction (sometimes called dehydration synthesis). This reaction, as the name implies, releases a water molecule.
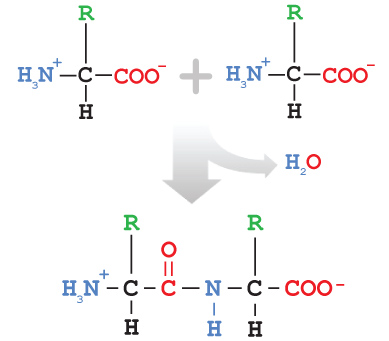
The bond joining two amino acids is called a peptide bond, and the pair of linked amino acids is called a dipeptide. A long string of amino acids is called a polypeptide, or simply a peptide or protein.
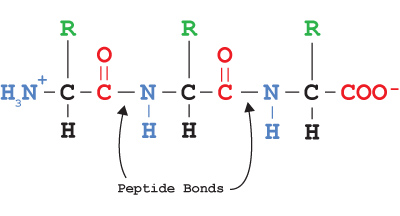
Proteins have an N-terminus (containing an amino group) and a C-terminus (containing a carboxylic acid group). When a protein sequence is written out, it is always written beginning the N-terminus and ending with the C-terminus, since this is the order in which the protein is constructed in the cell.
The linear order of amino acids within a protein is determined by the linear sequence of nucleotides within the DNA that codes for the protein. The portion of the DNA that codes for a protein is called a gene.
To make a protein, the gene must first be copied into mRNA in a process called transcription. The mRNA is processed and transported to the cytoplasm, where the code is read and the protein is synthesized on ribosomes in a process called translation.
The primary structure of a protein is the linear sequence of amino acids joined together by peptide bonds
Amino acids consist of a common backbone (which allows them to be joined together in any order) and a variable R group, which impacts both the final protein structure and its function.
The secondary structure of a protein refers to stable local folding of portions of the protein involving hydrogen bonding between backbone atoms. The two most common secondary structures are the alpha helix and the beta pleated sheet.
The secondary structure is maintained by hydrogen bonds between the backbone atoms. These form between the H of the N (amide hydrogen) and the O of C=O (carbonyl oxygen).
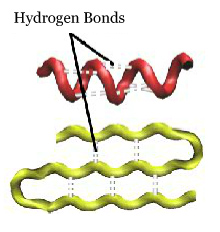
Alpha helices form a right-handed corkscrew within a protein. Alpha helices can range in length from very short (involving only a few amino acids) to very long (up to over seventy amino acids). Click on the buttons below to see alpha helices (colored red) within a protein.
Alpha helices are pictured in the proteins insulin and beta globin and can be identified by the color red. Note they look like a corkscrew. (2HIU.pdb, 1A3N.pdb)
Insulin PDB ID: 2hiuDigging Deeper
Count the number of hydrogen bonds and the number of amino acids in the highlighted alpha helix. In this image, backbone atoms are colored in soft cpk (light gray, pink and light blue), and sidechains flash between red and cpk.
Hydrogen Bonds in an Alpha Helix PDB ID: 1a3nDetermine the ratio of hydrogen bonds per amino acid.
Where are the amino acid sidechains located in relation to the backbone atoms in the alpha helix?
The second common secondary structure is the beta pleated sheet, which consists of two or more beta strands. The backbone of a beta strand bends back and forth like a pleat (hence the name). Alternating sidechains are on opposite surfaces of the beta sheet. Hydrogen bonds connect adjacent strands.
Adjacent beta strands can lie in two different orientations. If the N-termini of both strands are adjacent to each other, they are said to be parallel beta strands, The hydrogen bonds between parallel beta strands zig zag between the strands, much like the lace in a shoe.
If the N-terminus of one strand lies adjacent to the C-terminus of the other strand, the two strands are said to be antiparallel beta strands. The hydrogen bonds between antiparallel beta strands run parallel to one another and look like the rungs of a ladder.
A protein may contain both parallel and antiparallel beta strands, often within the same beta sheet!
Beta pleated sheets look like parallel lines in the green fluorescent protein (GFP) and are colored yellow. (1EMB.pdb) GFP is the protein that makes jellyfish glow, and it has been engineered to glow various colors (blue, red, gold). Scientists sometimes insert this gene in front of a gene they are studying to understand better when and where the protein is expressed in an individual. Perhaps you have seen images of glowing mice!
Green Fluorescent Protein PDB ID: 1embDigging Deeper
Look at the selected beta pleated sheet from green fluorescent protein (GFP).
Beta Pleated Sheet PDB ID: 1embCount the number of hydrogen bonds and the number of amino acids in the selected beta sheet.
Determine the ratio of hydrogen bonds per amino acid.
Where are the amino acid sidechains located in relation to the protein backbone in the beta sheet?
Most of the beta strands in this beta barrel are antiparallel. See if you can spot the two beta strands that are parallel in the structure. (Hint: look at the position of the white hydrogen bonds between beta strands.)
Protein tertiary structure is due to interactions between R groups in the protein. Note that these R groups MUST be facing each other to interact. There are four types of tertiary interactions: hydrophobic interactions, hydrogen bonds, salt bridges, and sulfur-sulfur covalent bonds. Each of these will be explored below.
Hydrophobic interactions are due to non-polar sidechains 'liking' to be near each other and away from any polar or charged sidechains. Hydrophobic interactions occur when two non-polar sidechains interact. These interactions are often found on the inside of the protein since the cellular environment is mostly aqueous.
Triose phosphate isomerase (TPI) is an enzyme involved in glycolysis. Hydrophobic sidechains flash yellow, then cpk colors. Note the interaction between sidechains with backbone highlighted in yellow at the end of the sequence. (2YPI.pdb)
Hydrophobic Interactions PDB ID: 2ypiAre hydrophobic residues located mostly on the surface of the protein or on the inside of the protein? Why do you think that is the case?
Hydrogen bonds form between polar groups – one of which MUST have a polar hydrogen atom. Hydrogen atoms are polar when bonded to either an N or O atom. That hydrogen is then attracted to another N or O.
Look at these two sidechains in GATA-1/FOG-1 (1Y0J.pdb). See if you can determine which two atoms will form a hydrogen bond.
Hydrogen Bonding Between Polar Groups PDB ID: 1y0jDo one or both of the groups have a polar hydrogen?
Salt bridges are due to the attractions of positively charged sidechains to negatively charged sidechains. Click on the buttons below to view the positively and negatively charged sidechains in TPI. (2YPI.pdb)
Positive sidechains flash blue in this image.
Positively Charged Sidechains PDB ID: 2ypiNegative sidechains flash red in this image.
Negatively Charged Sidechains PDB ID: 2ypiNote the interaction between the two oppositely charged sidechains with the purple backbone.
Do these interactions occur on the inside or outside of the protein? Why?
Covalent sulfur-sulfur (disulfide) bonds only form between two cysteine amino acid residues (an amino acid that is part of the peptide chain). The cysteines lose the hydrogen from the -SH group and form an S-S bond.
Insulin has three disulfide bonds. Two of the disulfide bonds are between the two chains. The one shown here forms between two cysteines on the same chain.
Disulfide Bonds PDB ID: 2hiuHow does the strength of this interaction compare to the other three interactions?
Tertiary structure refers to the interactions between amino acid sidechains within a protein. These interactions will only occur if the sidechains are near each other in three-dimensional space; the interactions between sidechains often drive protein folding.
Whereas all proteins have primary, secondary and tertiary strucuture, not all proteins possess quaternary structure. Quaternary structure occurs when proteins are made of two or more polypeptides (called subunits or chains).
When a protein consists of two subunits, and both subunits are identical, it is called a homodimer (homo=same; di=two). If it consists of two subunits which are different, it is called a heterodimer (hetero=other). Some proteins, such as RNA polymerase, are quite large, containing many different subunits. These are called multimeric proteins.
Insulin is a heterodimer, containing, an A chain and a B chain.
The A chain of insulin is shown in medium spring green.
The B chain of insulin is shown in hot pink.
Insulin Chain B Hot Pink PDB ID: 2hiuThe subunits in proteins with quaternary structure are held together by the same types of interactions as in the tertiary structure, except the interactions also occur between chains, instead of only within a single chain. Explore these interactions in the proteins below.
Hemoglobin carries oxygen in the blood. You explored the beta subunit (beta globin) earlier in this tutorial (1A3N.pdb). It consists of two alpha subunits and two beta subunits. Only one of each of the two different subunits is displayed here. Two pairs of interactions are shown here; sidechains are in cpk, and the backbone atoms of interaction sidechains are colored green or blue.
Hydrophobic Interactions in Hemoglobin PDB ID: 1a3nTriose phosphate isomerase (TPI) is an enzyme in the glycolytic pathway. (2YPI.pdb) TPI is a homodimer. Three salt bridges between the subunits are shown here; the backbone of each pair of interacting subunits is colored differently.
Salt Bridges in TPI PDB ID: 2ypiTPI (2YPI.pdb). Although two hydrophobic sidechains are shown here, hydrogen bonds form between the polar backbone atoms of these residues. Note that two hydrogen bonds form between each pair. Remember that hydrogen atoms are not displayed, but are present between the N and O atoms shown here.
Hydrogen Bonds in TPI PDB ID: 2ypiInsulin is a peptide hormone involved in regulating blood glucose levels. (2HIU.pdb) Insulin is a heterodimer; two interchain disulfide bonds (inter=between, as in interstate highway) join the A and B chains; a third intrachain disulfide bond (intra=within) stabilizes the A chain.
Disulfide Bonds in Insulin PDB ID: 2hiuThusfar you have reviewed the four levels of protein structure and have become familar with visualizing proteins using computer models. Now you will look at specific interactions between two proteins and a protein and DNA. These are the same types of interactions that occur between enzymes and substrates.
Remember that enzymes are proteins in which the amino acid sidechains serve as the binding site by holding the substrate in the correct orientation and also serve as the catalytic group that changes the substrate to the product.
About 2-3% of proteins encoded by the human genome are zinc finger proteins. A zinc finger protein has a zinc atom bound to the protein, typically via four amino acids (usually histidine and/or cysteine residues). The amino acids are located on a two-strand beta sheet and an alpha helix that together look like two 'fingers', with the zinc atom lodged between them. These proteins have a specific affinity and so are very useful in binding to other proteins, DNA, RNA or lipids.
A typical zinc finger motif is shown here, with beta strands in yellow and the alpha helix in red. The amino acids coordinating the zinc are in CPK, and the zinc atom is brown.
Zinc Finger Motif PDB ID: 1zaaGATA-1 and FOG-1 (Friend of GATA) are large zinc finger proteins involved in regulating gene expression by binding to DNA. You will be looking at both the interactions between GATA-1 and FOG-1 and between GATA-1 and DNA.
GATA-1 and FOG-1 are transcription factors that are essential for normal development of embryonic erythrocytes (red blood cells) and megakaryocytes (bone marrow cells responsible for making platelets). In order for correct gene expression to occur FOG-1 must bind to GATA-1 before GATA-1 binds to DNA. Mutation of GATA-1/FOG-1 genes can lead to human blood related diseases.
Both GATA-1 and FOG-1 are zinc finger proteins. That means that they have a zinc atom as part of the structure. The zinc atoms are important to the 3-D structure. Use the buttons below to explore how GATA-1 and FOG-1 coordinate (bind) the zinc atoms. (1Y0J.pdb)
The backbone of GATA-1 is colored orchid. The zinc atom (flashing green and brown) is coordinated — or held in place — by four amino acids, seen here in ball and stick and flashing between purple and cpk.
GATA-1 PDB ID: 1y0jIn the next image, the backbone of FOG-1 is colored lime green. The zinc atom (flashing green and brown) is coordinated — or held in place — by four amino acids, seen here in ball and stick and flashing between orchid and cpk.
FOG-1 PDB ID: 1y0jAre the amino acids that coordinate the zinc atom the same in GATA-1 and FOG-1?
What type(s) of interactions occur between the zinc atom and these amino acids?
Click on the following buttons and determine the type of interaction displayed between GATA-1 and FOG-1.
GATA-1/FOG-1: Interaction 1 PDB ID: 1y0jWhat type of interaction is interaction 1?
hydrophobic interaction
hydrogen bond
sulfur-sulfur (disulfide) bond
salt bridge
What type of interaction is interaction 2?
hydrophobic interaction
hydrogen bond
sulfulr-sulfur (disulfide) bond
salt bridge
What type of interaction is interaction 3?
hydrophobic interaction
hydrogen bond
sulfur-sulfur (disulfide) bond
salt bridge
What type of interaction is interaction 4?
hydrophobic interaction
hydrogen bond
sulfur-sulfur (disulfide) bond
salt bridge
GATA-1 also interacts with DNA. The interaction is similar to a right hand holding a rope with the rope being the DNA and the hand being the GATA-1. The GATA-1 carboxyl tail is thought to cause the kink in the DNA to allow the GATA-1 to interact with one of the DNA strands.
Click on the following buttons to determine the types of interactions occurring between GATA-1 and DNA.
GATA-1/DNA: Interaction 5 PDB ID: 2gatWhat interaction does the orange residue have with the DNA in interaction 5?
What interactions are seen between the orange residue and DNA in interaction 6?
What interactions occur between the orange residue and DNA in interaction 7?
Click on the following buttons to explore interactions occurring between the phosphate group of the sugar-phosphate backbone on the DNA and the GATA-1. Note that these interactions occur in the minor groove of the DNA.
GATA-1/DNA: Interaction 8 PDB ID: 2gatHow does the lime green residue interact with the phosphate in DNA in interaction 8?
How does the lime green residue interact with the phosphate in DNA in interaction 9?
Arginine 54 and arginine 56 are displayed here. Note their positions relative to the DNA strand. These two amino acids residues cause the DNA to bend in the direction of the minor groove. This allows the two strands to separate enough for transcription to occur.
Arginine Residues that Bend DNA PDB ID: 2gat